Financial KPIs Explained: Make Smarter, Safer, and More Profitable Decisions
Whether you’re buying new equipment, expanding your service area, or just trying to improve your margins, the smartest business owners track more than just revenue. This guide covers 18 of the most powerful financial KPIs and investment metrics—from simple liquidity ratios to strategic ROI tools like IRR and CAPM.
Each one includes:
- What it means
- The formula
- Where to get the data
- A small business example
- What the result tells you
- What to do about it
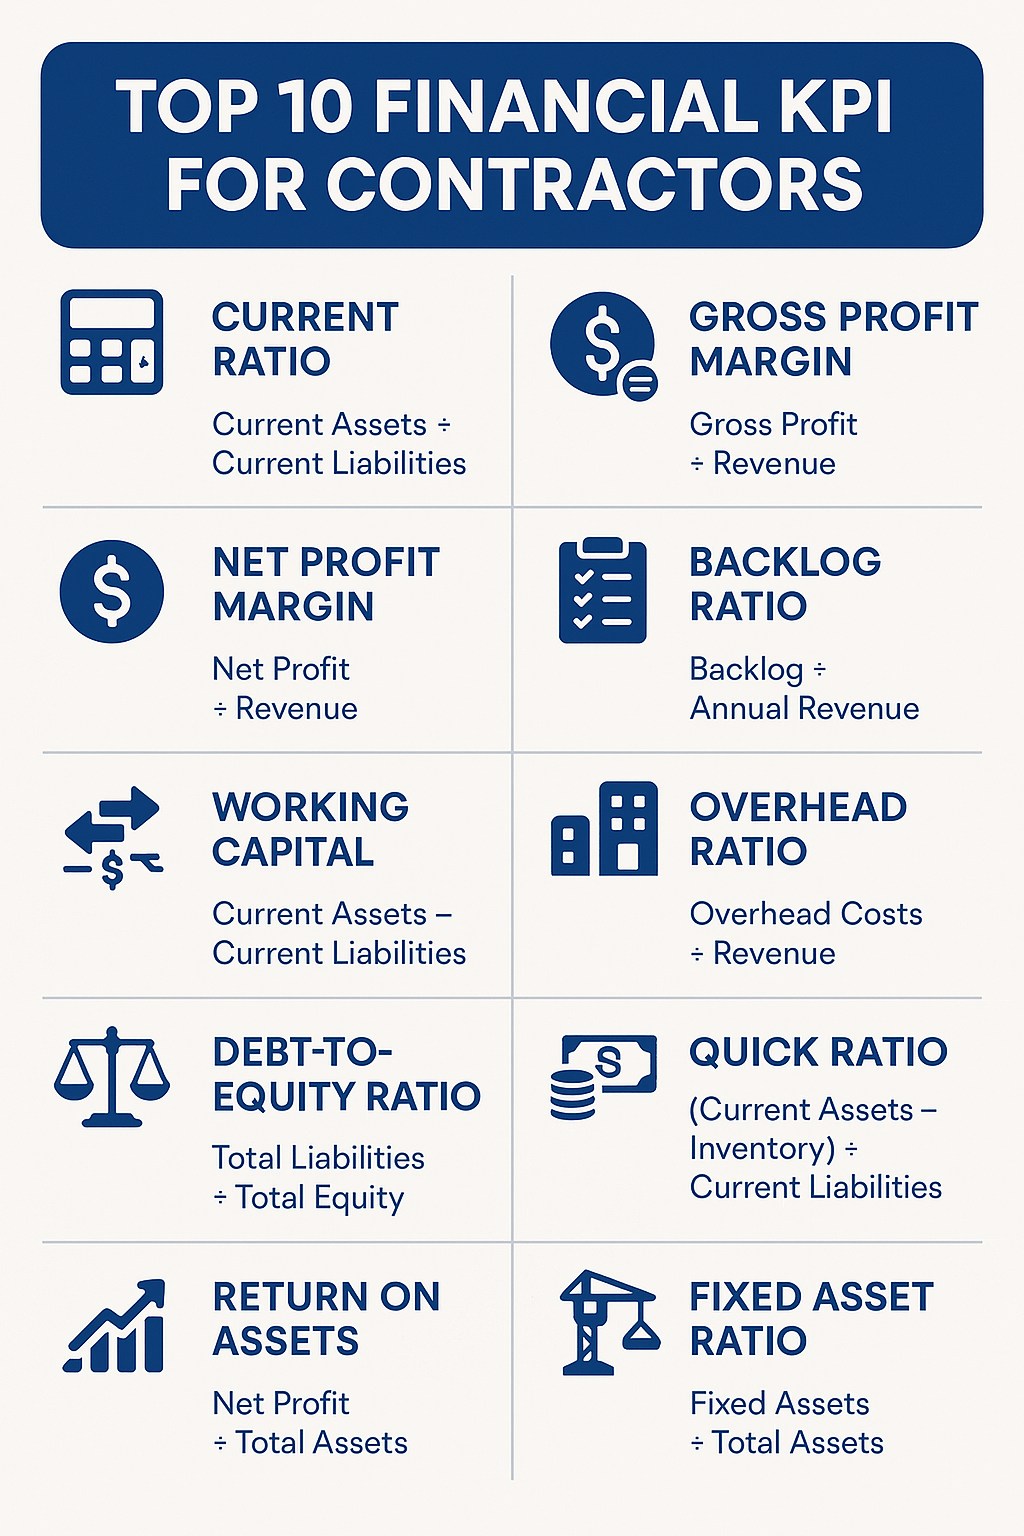
SECTION 1: Core Financial KPIs (Tracked Monthly or Quarterly)
1. Return on Assets (ROA)
Formula: Net Income / Total Assets
Example: $50,000 / $400,000 = 12.5%
Why it matters: This shows how efficiently you use assets. Under 5%? You may have underperforming equipment or property.
2. Return on Equity (ROE)
Formula: Net Income / Shareholder Equity
Example: $30,000 / $200,000 = 15%
Why it matters: Indicates your business is yielding strong returns on your own capital.
3. Gross Profit Margin
Formula: (Revenue – COGS) / Revenue
Example: (150k – 90k) / 150k = 40%
Why it matters: A strong gross margin covers overhead and drives profitability.
4. Operating Profit Margin
Formula: Operating Income / Revenue
Example: 60k / 300k = 20%
Why it matters: Tells you how profitable your business is before taxes and interest.
5. Net Profit Margin
Formula: Net Profit / Revenue
Example: 18k / 180k = 10%
Why it matters: The ultimate profitability measure. Under 5%? Check pricing, COGS, or overhead.
6. Quick Ratio
Formula: (Cash + AR) / Current Liabilities
Example: (15k + 10k) / 12k = 2.08
Why it matters: Shows if you can pay short-term obligations without inventory.
7. Current Ratio
Formula: Current Assets / Current Liabilities
Example: 7k / 3.5k = 2.0
Why it matters: Under 1.0 = cash crunch risk. Over 3.0 = possible inefficiency.
8. Inventory Turnover
Formula: COGS / Average Inventory
Example: 200k / 40k = 5x/year
Why it matters: Too low? You’re holding slow-moving or excess stock.
9. Accounts Receivable Turnover
Formula: Net Credit Sales / Average AR
Example: 150k / 25k = 6x/year
Why it matters: Low turnover = slow payments and stressed cash flow.
10. Debt-to-Equity Ratio
Formula: Total Liabilities / Shareholder Equity
Example: 100k / 80k = 1.25
Why it matters: Over 2.0 = high leverage risk. Under 1.0 = more conservative.
11. Interest Coverage Ratio
Formula: EBIT / Interest Expense
Example: 45k / 12k = 3.75
Why it matters: Under 2.0 = dangerous. Over 3 = strong debt-handling ability.
12. Customer Acquisition Cost (CAC)
Formula: Sales & Marketing Costs / New Customers
Example: $5,000 / 25 = $200 per customer
Why it matters: CAC must be less than 1/3 of customer LTV.
13. Customer Lifetime Value (LTV)
Formula: Avg Revenue × Gross Margin × Retention Period
Example: $75 × 60% × 12 = $540
Why it matters: If LTV isn’t at least 3× CAC, your acquisition isn’t sustainable.
14. Burn Rate
Formula: Operating Expenses – Revenue (monthly)
Example: $40k – $25k = $15k/month burn
Why it matters: Know your runway. With $90k cash, you have 6 months.
15. Break-Even Point
Formula: Fixed Costs / (Price – Variable Cost per Unit)
Example: $10,000 / ($20 – $8) = 833 units/month
Why it matters: If you can’t hit break-even sales consistently, you’re losing money.
SECTION 2: Strategic Investment Metrics (Use for Big Decisions)
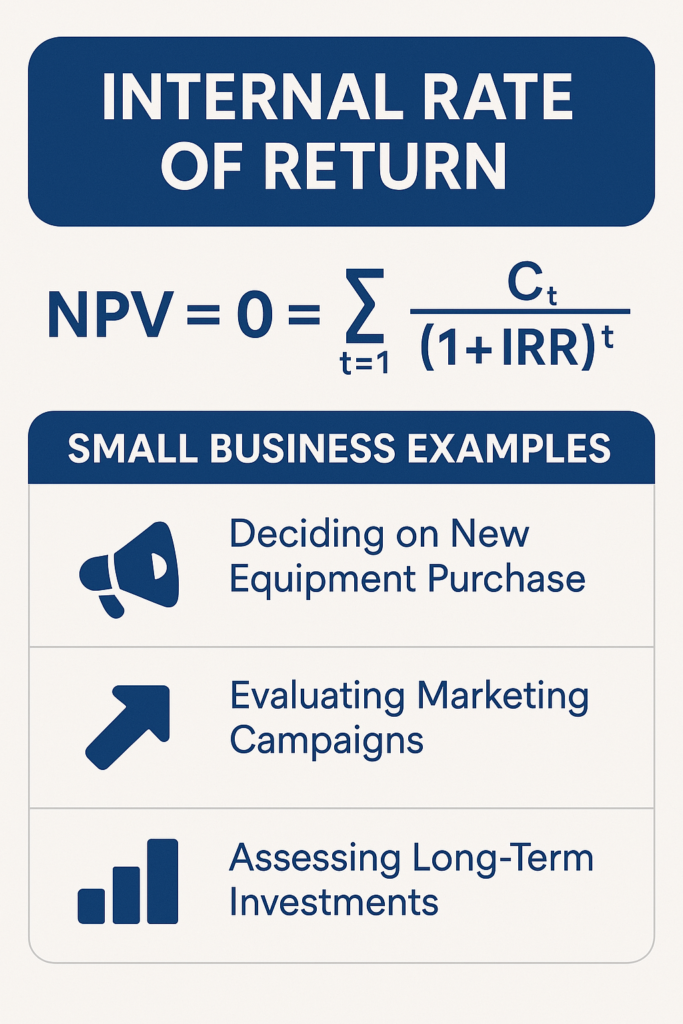
16. Internal Rate of Return (IRR)
Formula: Use Excel’s =IRR() function with projected cash flows.
Example:
$10,000 ad campaign generates $800/month for 18 months.
IRR = ~42%
Why it matters: If IRR > your cost of capital (say 12%), the project adds value.
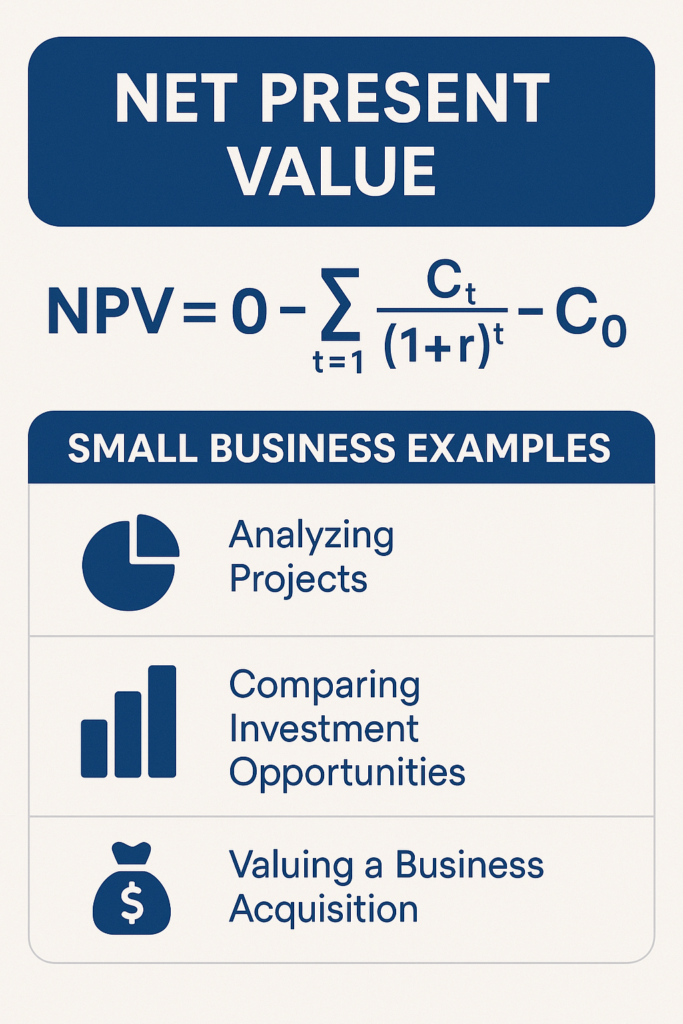
17. Net Present Value (NPV)
Formula:
NPV = ∑ (Cash flow / (1 + discount rate)^t) – Initial Investment
Example: $1,000/month return for 12 months, 10% rate, $8,000 investment
NPV ≈ $2,345
Why it matters: Positive NPV = profitable project. Negative = avoid or re-evaluate.
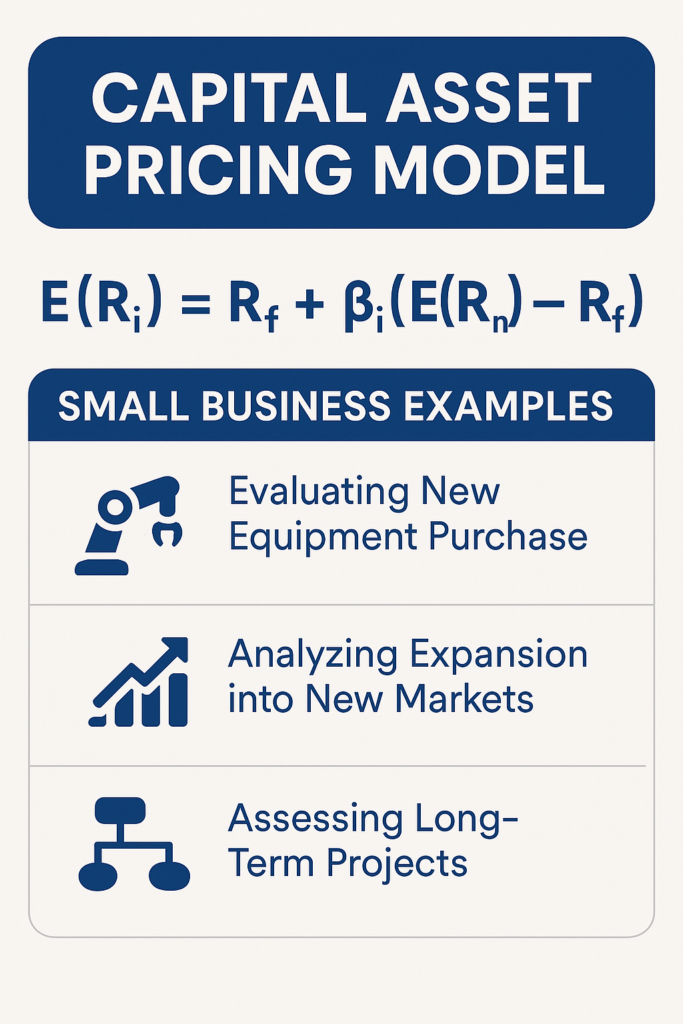
18. Capital Asset Pricing Model (CAPM)
Formula:
Expected Return = Risk-Free Rate + Beta × (Market Return – Risk-Free Rate)
Inputs:
- Risk-Free Rate: 10-Year Treasury yield, e.g., 4% (from MarketWatch or Treasury.gov)
- Market Return: Historical S&P 500 average = ~10%
- Beta: From comparable public companies on Yahoo Finance (e.g., 1.5 for construction firms)
Example – Equipment Investment:
4% + 1.5 × (10% – 4%) = 13% expected return
Why it matters: Only pursue risky investments if expected return exceeds the CAPM threshold. Otherwise, the risk isn’t justified.
Final Thoughts: Know Your Numbers, Make Better Moves
These KPIs and investment metrics aren’t just for big corporations—they’re essential tools for every small business. They help you:
- Set smarter pricing
- Avoid cash flow surprises
- Justify or reject investments
- Improve profitability
- Grow sustainably
Want Help Applying This to Your Business?
At Key Forecasts, we turn your numbers into insights and action plans. We’ll build your dashboard, analyze your ratios, and show you how to improve your business financially.
Book your free consultation today:
https://keyforecasts.com