Financial models are essential tools used to represent the financial performance of a business, project, or investment. They help analysts forecast future earnings, assess risks, and make informed decisions. Financial analysis involves evaluating financial statements and data to understand a company’s financial health, profitability, and stability. This analysis is crucial for investors, creditors, and management to make strategic business decisions. Financial reporting, on the other hand, is the process of disclosing financial data and information to stakeholders, ensuring transparency and compliance with accounting standards.
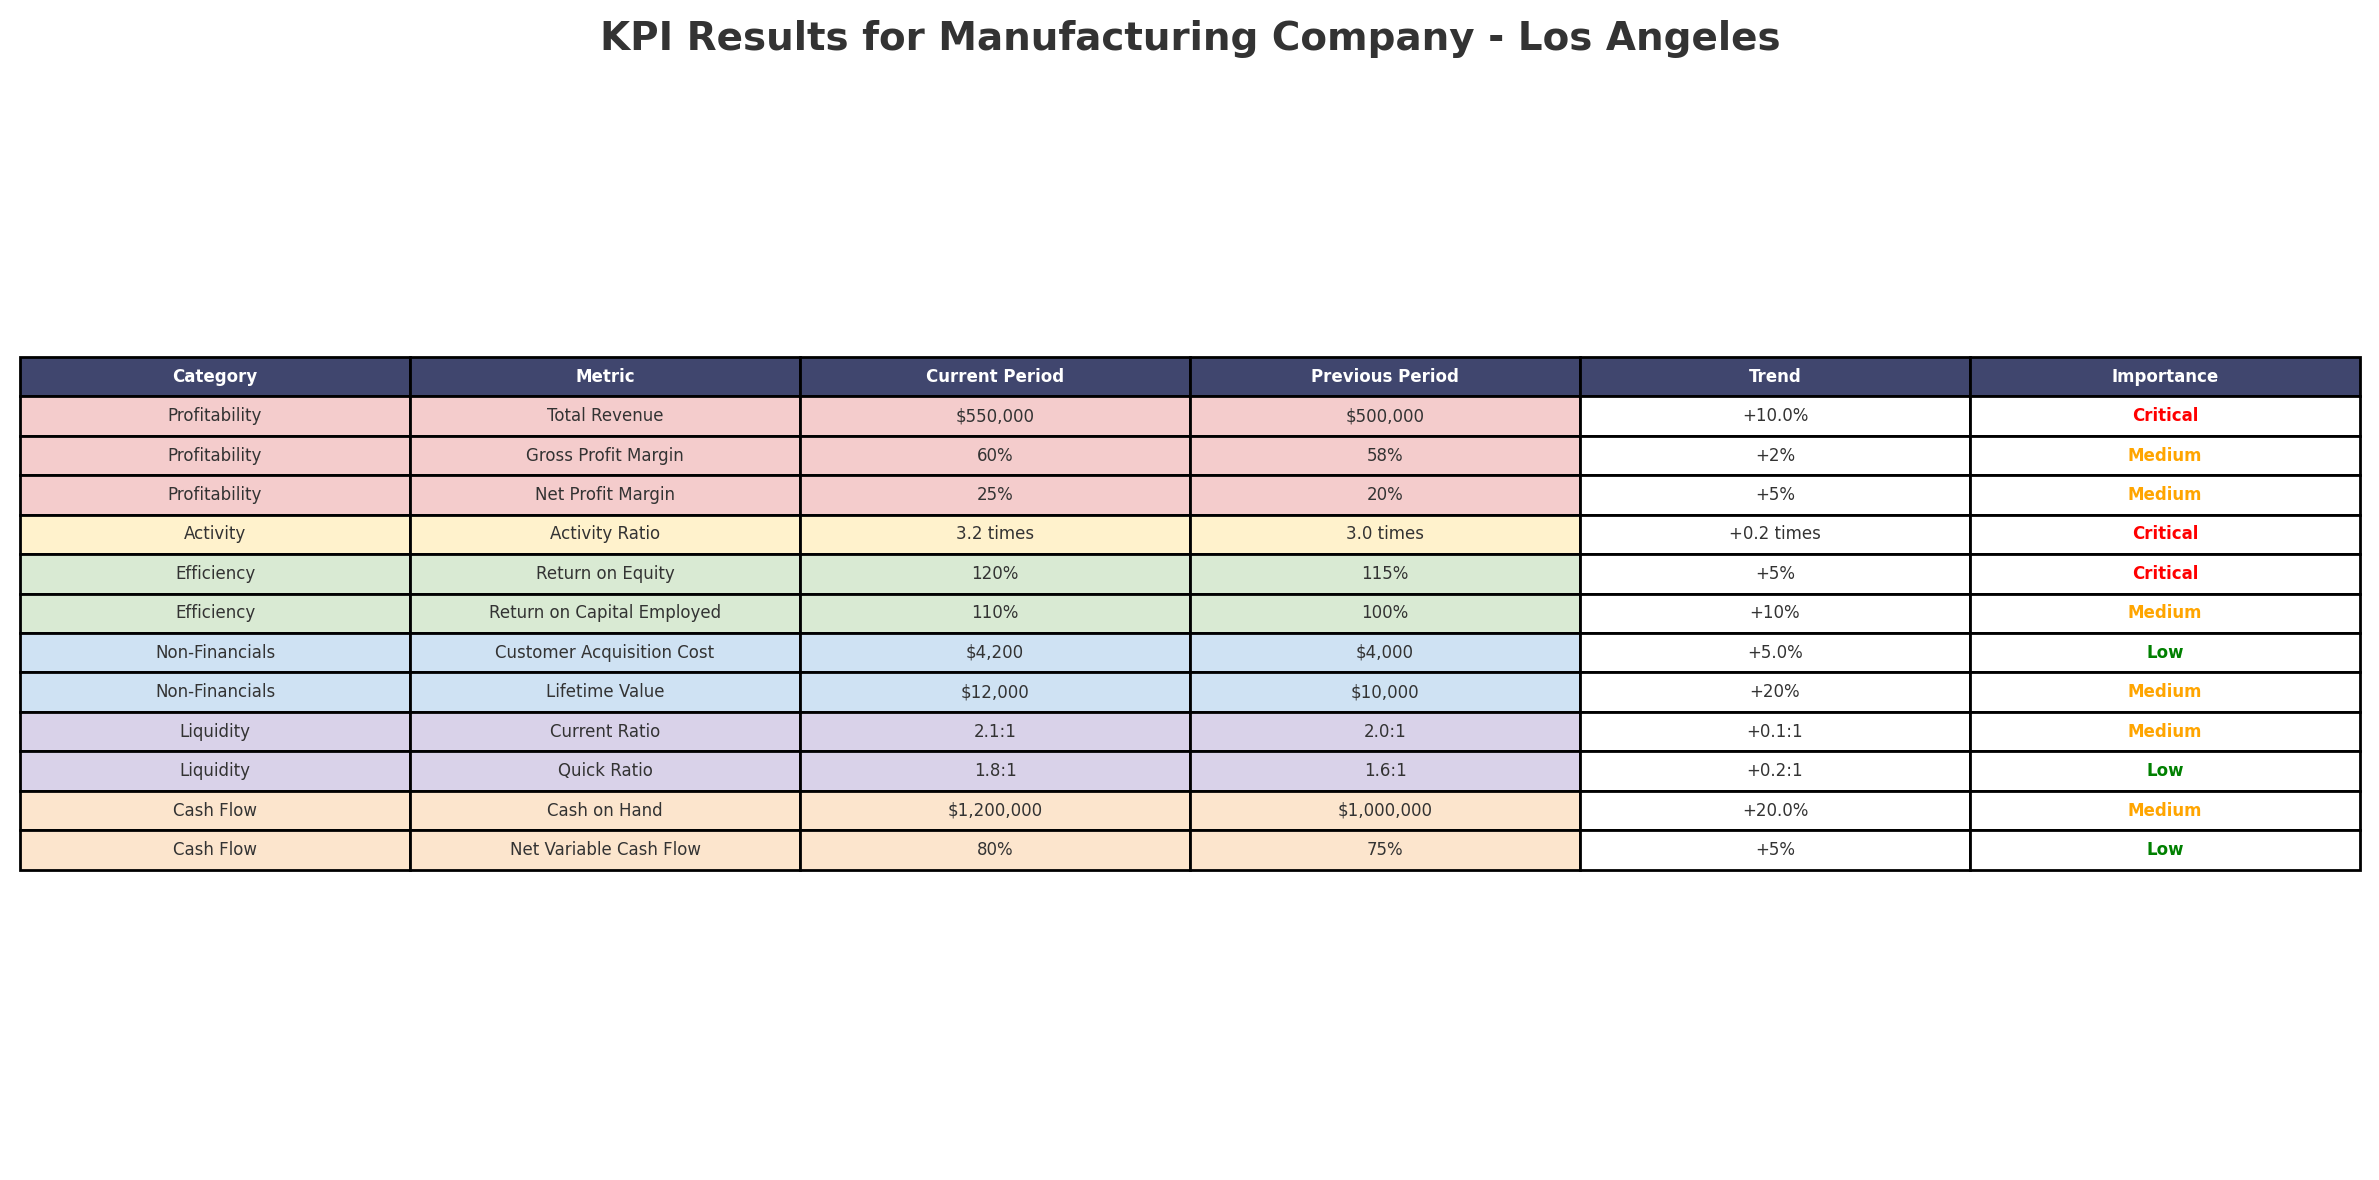
Key Performance Indicators (KPIs) are metrics used to measure the success and efficiency of various aspects of a business. By monitoring KPIs, organizations can track progress towards goals, identify areas for improvement, and enhance overall performance. Together, financial models, analysis, reporting, and KPIs provide a comprehensive framework for strategic financial management.
Financial ratios and evaluation metrics are essential tools for understanding the financial health of a business, assessing investment opportunities, and making strategic decisions. By knowing what each ratio and metric represents and how to calculate them, you can gain valuable insights into profitability, efficiency, liquidity, leverage, and long-term value creation. Below is a comprehensive list of financial ratios and metrics, including how and why they’re used.
Liquidity Ratios:
1. Current Ratio = Current Assets / Current Liabilities
• Measures short-term liquidity, indicating whether a business can cover its short-term obligations.
2. Quick Ratio = (Current Assets – Inventory) / Current Liabilities
• Focuses on highly liquid assets, excluding inventory, to assess immediate solvency.
3. Cash Ratio = Cash & Cash Equivalents / Current Liabilities
• Evaluates a company’s ability to meet short-term liabilities using only cash.
4. Operating Cash Flow Ratio = Operating Cash Flow / Current Liabilities
• Tracks the ability of cash generated from operations to cover short-term obligations.
Profitability Ratios:
5. Gross Margin = Gross Profit / Revenue
• Shows the percentage of revenue remaining after covering direct costs.
6. Operating Margin = Operating Income / Revenue
• Indicates the portion of revenue left after covering operating expenses.
7. Net Profit Margin = Net Income / Revenue
• Measures overall profitability after all expenses.
8. Return on Assets (ROA) = Net Income / Total Assets
• Assesses how effectively assets are used to generate profit.
9. Return on Equity (ROE) = Net Income / Shareholder’s Equity
• Evaluates profitability from the shareholders’ perspective.
10. Return on Investment (ROI) = (Net Profit / Investment Cost) x 100
• Measures the efficiency of an investment.
11. Return on Capital Employed (ROCE) = EBIT / (Total Assets – Current Liabilities)
• Indicates profitability relative to capital used in the business.
Efficiency Ratios:
12. Inventory Turnover = Cost of Goods Sold / Average Inventory
– Measures how quickly inventory is sold.
13. Accounts Receivable Turnover = Revenue / Average Accounts Receivable
– Tracks how efficiently receivables are collected.
14. Accounts Payable Turnover = Cost of Goods Sold / Average Accounts Payable
– Shows how quickly payables are paid.
15. Asset Turnover Ratio = Revenue / Total Assets
– Indicates how effectively assets generate revenue.
16. Days Inventory Outstanding (DIO) = (Average Inventory / Cost of Goods Sold) x 365
– Reflects how long inventory stays before being sold.
17. Days Sales Outstanding (DSO) = (Average Accounts Receivable / Revenue) x 365
– Shows how many days it takes to collect receivables.
18. Days Payable Outstanding (DPO) = (Average Accounts Payable / Cost of Goods Sold) x 365
– Measures the average time it takes to pay suppliers.
19. Cash Conversion Cycle = DIO + DSO – DPO
– Represents the time it takes to convert resources into cash flows.
Leverage Ratios:
20. Debt-to-Equity Ratio = Total Debt / Shareholder’s Equity
– Measures the proportion of debt used to finance the business.
21. Debt-to-Assets Ratio = Total Debt / Total Assets
– Shows what percentage of assets are financed by debt.
22. Interest Coverage Ratio = EBIT / Interest Expense
– Tracks how easily a company can meet interest payments.
23. Fixed-Charge Coverage Ratio = (EBIT + Fixed Charges) / (Fixed Charges + Interest)
– Indicates the company’s ability to cover fixed obligations.
24. Equity Ratio = Shareholder’s Equity / Total Assets
– Reflects the portion of assets funded by shareholders.
Valuation Ratios:
25. Price-to-Earnings Ratio (P/E) = Market Price per Share / Earnings per Share
– Evaluates how much investors are willing to pay for each dollar of earnings.
26. Price-to-Sales Ratio (P/S) = Market Capitalization / Revenue
– Compares a company’s stock price to its revenues.
27. Price-to-Book Ratio (P/B) = Market Price per Share / Book Value per Share
– Relates stock price to the company’s net asset value.
28. Enterprise Value-to-EBITDA (EV/EBITDA) = Enterprise Value / EBITDA
– Measures the value of a company compared to its earnings before interest, taxes, depreciation, and amortization.
29. Dividend Yield = Annual Dividends per Share / Market Price per Share
– Shows the percentage return from dividends.
Market Performance Ratios:
30. Earnings per Share (EPS) = Net Income / Number of Outstanding Shares
– Indicates the portion of a company’s profit allocated to each share of stock.
31. Dividend Payout Ratio = Dividends / Net Income
– Shows how much of earnings is paid out as dividends.
32. Dividend Coverage Ratio = Net Income / Dividends
– Measures how easily a company can pay dividends.
33. Book Value per Share = (Total Equity – Preferred Equity) / Number of Outstanding Shares
– Reflects the book value allocated to each share.
Investment and Project Evaluation Metrics:
34. Net Present Value (NPV) = Σ (Cash Flow_t / (1 + r)^t) – Initial Investment
– The value of future cash flows discounted back to the present.
35. Internal Rate of Return (IRR): The discount rate that makes NPV = 0.
36. Payback Period: Time required to recover the initial investment from cash inflows.
37. Discounted Payback Period: Time required to recover the initial investment using discounted cash inflows.
38. Accounting Rate of Return (ARR) = Average Annual Accounting Profit / Initial Investment
– Measures the return based on accounting income rather than cash flow.
39. Profitability Index (PI) = Present Value of Future Cash Flows / Initial Investment
– Indicates the relative profitability of a project.
40. Modified Internal Rate of Return (MIRR): Adjusted IRR considering cost of capital and reinvestment rates.
41. Capital Asset Pricing Model (CAPM) = Risk-Free Rate + Beta x (Market Return – Risk-Free Rate)
– Calculates the expected return on an asset considering its risk relative to the market.
42. Weighted Average Cost of Capital (WACC) = (E/V x Re) + (D/V x Rd x (1-T))
– The average rate a company expects to pay on its capital sources.
Other Financial Ratios:
43. Operating Margin after Depreciation: (Operating Income – Depreciation) / Revenue
44. Effective Tax Rate: Income Tax Expense / Earnings Before Taxes
45. Dividend Growth Rate: (D1 – D0) / D0 (where D1 and D0 are dividends at different times)
46. Free Cash Flow to Equity (FCFE): Operating Cash Flow – Capital Expenditures + Net Debt Issued
47. Free Cash Flow to Firm (FCFF): EBIT x (1 – Tax Rate) + Depreciation & Amortization – Capital Expenditures – Change in Working Capital
This comprehensive list includes the full spectrum of liquidity, profitability, efficiency, leverage, valuation, and market performance ratios, along with investment and project evaluation metrics like NPV, IRR, and CAPM. By using these measures, businesses can thoroughly evaluate their financial health, benchmark performance, and make well-informed strategic decisions.
Predictive Analytics for Small Business
Predictive analytics often uses financial ratios and historical data as input to forecast future performance. While traditional ratios are backward-looking, predictive models incorporate trends and patterns to estimate future outcomes. Examples of predictive analytics applied in finance include:
1. Revenue and Sales Forecasting:
Using historical revenue trends, seasonality, and external market data, predictive models can estimate future sales volumes, revenue streams, and growth rates. This helps businesses anticipate cash flow needs and set realistic financial goals.
2. Cost and Expense Projections:
By analyzing past spending patterns and current cost drivers, predictive analytics can forecast future operating expenses, material costs, and overhead. These projections help in budgeting and identifying areas for cost control.
3. Profitability Scenarios:
Combining historical profitability ratios with market trends and planned initiatives, predictive models can simulate future profit margins under various scenarios. This allows businesses to test different strategies and set financial targets.
4. Customer Lifetime Value (CLV):
In e-commerce and subscription-based models, predictive analytics can estimate the future value of customer relationships. By analyzing purchase behavior, retention rates, and cross-selling opportunities, businesses can forecast long-term revenue per customer.
5. Cash Flow Forecasting:
Predictive models use past cash inflows and outflows, along with external factors like interest rates or payment cycle changes, to forecast future cash positions. This ensures businesses maintain liquidity and avoid cash crunches.
6. Loan and Credit Risk Assessment:
Predictive models can use historical credit data and macroeconomic indicators to estimate default probabilities. This helps in setting appropriate loan terms and maintaining a healthy credit portfolio.
7. Inventory and Supply Chain Optimization:
By analyzing historical inventory turnover and supplier performance, predictive models can forecast demand fluctuations and optimize reorder points. This reduces holding costs and minimizes stockouts.
Predictive analytics doesn’t replace traditional financial ratios, but it adds a forward-looking dimension. Integrating these forecasts with current financial metrics provides a clearer picture of future performance and helps businesses make more proactive decisions.