HVAC Dashboard Mastery Guide
Welcome to your Key Forecasts HVAC Executive Dashboard. This platform transforms raw bookkeeping and dispatch data into actionable, fractional CFO insights for HVAC businesses.
Visualize Your Financial Health
Explore the robust, fractional CFO tools elite contractors rely on to dominate the Los Angeles HVAC market. Click any dashboard module below to expand and see the level of financial clarity we provide.

Part 1: Security & Setup
Bank-Grade Security
Your portal is strictly protected. All financial data is fully encrypted both in transit (SSL/TLS) and at rest, ensuring your sensitive business intelligence remains confidential.
Forgot Your Password?
Click the reset link on the login page to receive a secure, 1-hour expiring token via email.
Updating Your Company Profile
Before generating any reports, ensure your company information is accurate. This data is merged directly into your automated PDF summaries.
Part 2: Uploading Your Data
Upload two simple CSV files each month: your Financial Report (from QuickBooks/Xero) and your Operational Report (from ServiceTitan/Housecall Pro).
- 1Click the blue Upload button in the top navigation.
- 2Select the Report Date: Type the year and month (e.g.,
2026-03). - 3Attach Financial Report: Select your Profit & Loss CSV.
- 4Attach Operational Report: Select your KPI CSV.
- 5Click Upload Data.
CRITICAL NOTE: Always upload individual months (Jan, Feb, Mar). The dashboard will automatically calculate your annual totals. Never upload a 12-month “Full Year” CSV.
Mapping Accounts
If the system detects a new bookkeeping account, it will automatically pause and ask you to categorize it.
- You will be redirected to the Map Accounts screen.
- Next to each unmapped account, select the Master Category (e.g., Vehicle/Fleet Expenses).
- Click Save All Mappings.
Data Management
- Auto-Overwrite: If you uploaded a draft P&L, simply re-upload the correct file. It will safely overwrite.
- Delete a Month: Open the ⚙️ Customize panel, scroll to the bottom, select the month, and click Delete.
Part 3: Navigating & Trends
Time Travel (Period Selection)
Use the dropdown menu in the top-left corner to filter your view:
Period-over-Period Trends
When you select a specific month, you will see ↑ Green and ↓ Red arrows next to your numbers. The system automatically fetches the previous period and calculates your growth. Green always means “Good” (even if the number went down, such as your Callback Rate dropping).
Part 4: CFO Report Breakdown
The dashboard is broken down into critical tiers. Here is exactly how they are calculated, what the industry benchmarks are, and how to fix unfavorable numbers.
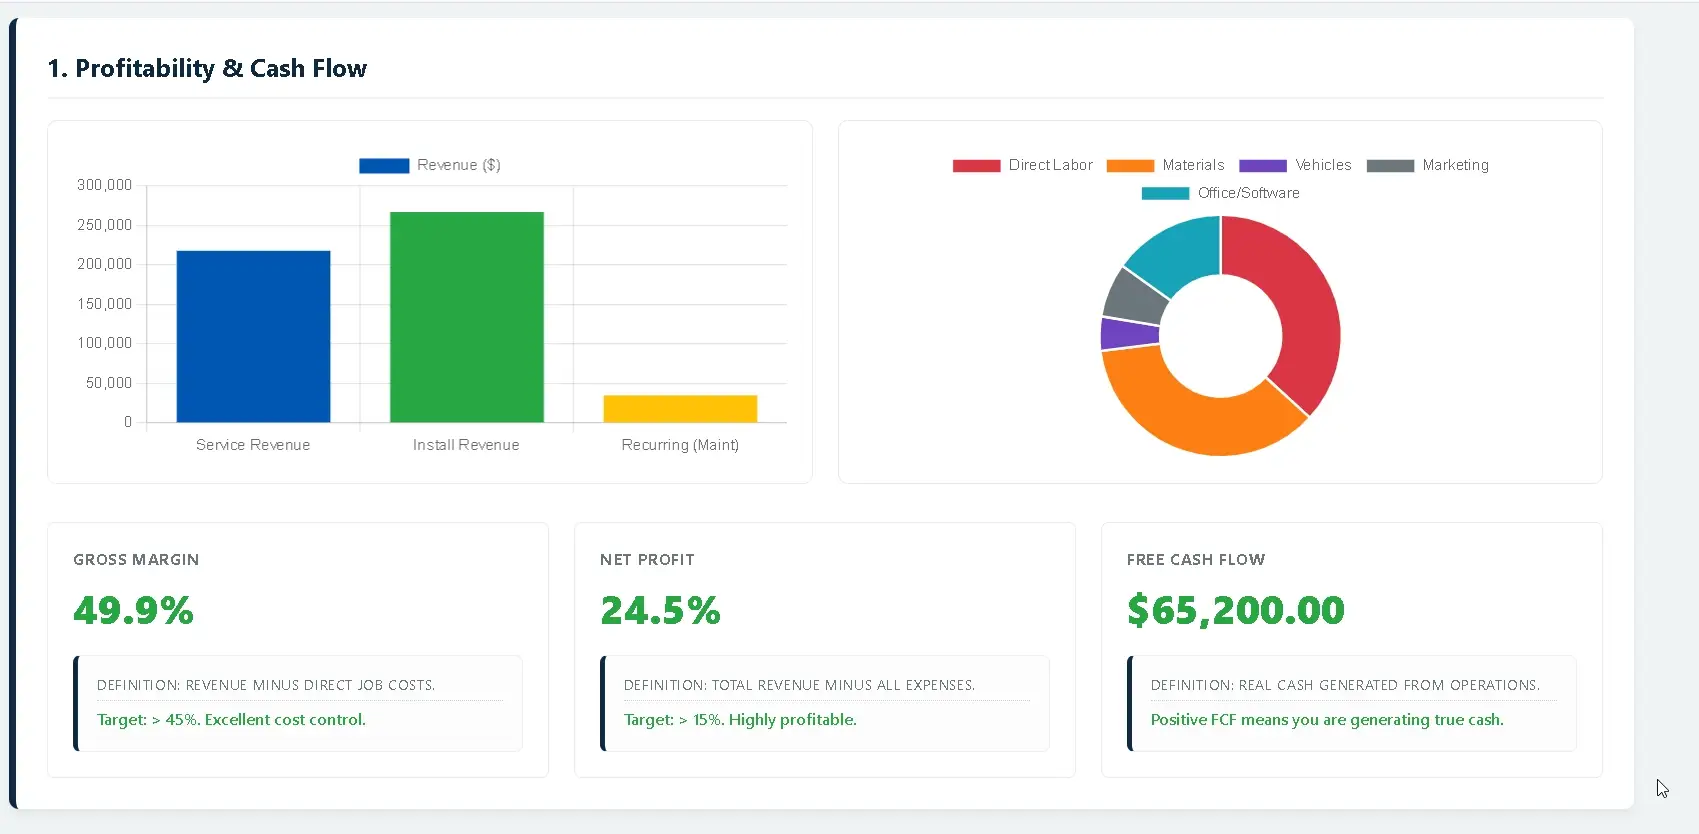
Tier 1: Profitability
Gross Margin (%)
Formula: (Total Revenue – COGS) / Total Revenue
Benchmark: 45% – 55%
Action: If below 40%, you have a pricing or waste issue. Raise prices, renegotiate materials, or audit technicians for unbilled materials.
Net Profit (%)
Formula: (Total Revenue – COGS – OpEx) / Total Revenue
Benchmark: 15%+ (Industry avg: 5-10%)
Action: If Gross is healthy but Net is low, overhead is too high. Audit fixed costs (software, payroll, rent).
Free Cash Flow ($)
Formula: Net Profit – Accounts Receivable
Meaning: True cash generated to buy trucks or take draws. If negative while Net is positive, tighten collection terms.
Tier 2: Financial Health
Cash on Hand ($)
Formula: Total liquid bank balances
Benchmark: Maintain enough cash to cover 1 to 2 months of Operating Expenses to survive shoulder seasons.
Debt-to-Income (DTI) (%)
Formula: (Short-Term Liabilities + Credit Cards) / Total Revenue
Benchmark: Under 30%
Action: If this turns red, too much future revenue is spoken for by creditors. Pause capital expenditures.
Tier 3: Operations
Average Ticket ($)
Benchmark: $800+ (blended)
Train techs to present options (Good/Better/Best) and offer IAQ add-ons.
First-Time Fix Rate (%)
Benchmark: 85% – 90%
If below 75%, audit truck stock and dispatching accuracy.
Callback Rate (%)
Benchmark: Under 5%
Callbacks kill profit. Review processes for rushing or lack of diagnostic skills.
Utilization Rate (%)
Benchmark: 75% – 85%
If below 60%, you are paying for excessive windshield time or shop standing.
Tier 4: Sales & Marketing
Close Rate (%)
Benchmark: 60%+ Service / 40%+ Replacements
Ensure comfort advisors are offering monthly payment plans on every quote.
Customer Acq. Cost (CAC)
Benchmark: Under $250
If this spikes, ad spend is inefficient or CSRs are failing to book leads.
Tech Generated Leads
Meaning: Replacement leads generated by techs. Implement a spiff program to reward handoffs.
Part 5: 6-Month Growth Forecast
At the bottom of your dashboard is a predictive modeling chart. It takes your most recently completed month of revenue and compounds it forward.
- 1. Open the ⚙️ Customize panel and locate the Forecast Scenario dropdown.
- 2. Toggle between targets, from a realistic Steady (2% MoM) to an Aggressive Ramp (5% MoM).
CFO Advice:
Use this chart to accurately time your capital expenditures. Don’t guess when you can afford to finance a new van; use the forecast to see exactly which month your revenue will naturally support the payment.
Part 6: Automated PDF Reports
Instantly package your dashboard into a clean, branded PDF to share with your leadership team, CPA, or bank.
- Click the green 📩 Email Report button in the navigation bar.
- Select the specific period you want to report on (e.g., March 2026 or 2025 Full Year).
- Confirm or type the email address you want the report sent to.
- Click Send Report.
- Look for a green success banner at the top of your screen. The PDF will arrive in seconds.
Frequently Asked Questions
Quick answers to help you master your Key Forecasts dashboard.
How secure is my financial data on the dashboard?
Do I need to upload a full-year report?
What happens if I accidentally upload the wrong file?
How often should I upload my reports?
How is the 6-Month Growth Forecast calculated?
What if my QuickBooks chart of accounts uses different names?
Where do the industry benchmarks come from?
How do I generate a PDF report for my CPA?
Can I change the email address where reports are automatically sent?
What operational software do I need to use this dashboard?
Need Strategic Help?
If you run into any formatting issues or need strategic advice on what your numbers are telling you, the Key Forecasts team is here to support your growth.